Mind
Auction Market Theory Explained: Value Area, POC and Why Price Moves
Every market is an auction. Once you see it that way, charts stop looking random and start looking like a negotiation.
Contains affiliate links; we may earn a commission at no cost to you (details). Educational only, not financial advice (disclaimer).
Forget the chart for a second. Picture a farmer’s market at 7 a.m.
A guy has a crate of tomatoes. He wants $5 a pound. Nobody bites. So he drops to $4. A couple of people buy. At $3, there’s a line. By noon he’s sold out, raises his price for tomorrow, and the game starts again.
That’s the whole idea behind auction market theory. Markets aren’t trying to go up or down. They’re trying to find trade. Price is just the advertisement.
The one sentence that changes how you see charts
The core claim, popularized by J. Peter Steidlmayer at the Chicago Board of Trade in the 1980s, is simple:
Price moves to facilitate trade. It explores higher until buyers stop showing up, then explores lower until sellers stop showing up.
Every rally is the market asking, “Anyone want to buy up here?” Every drop is it asking, “How about down here?” When the answer is “yes, a lot of us,” trade builds and price slows down. When the answer is “nope,” price gets rejected and moves on quickly.
That’s why some areas on a chart are crowded and choppy while others get skipped in a single candle. The crowded zones are where both sides agreed. The skipped zones are where one side didn’t.
Value: where the market agreed
If you stacked up how much volume traded at each price for a session, you’d get a sideways histogram called a volume profile. It usually looks like a lumpy bell.
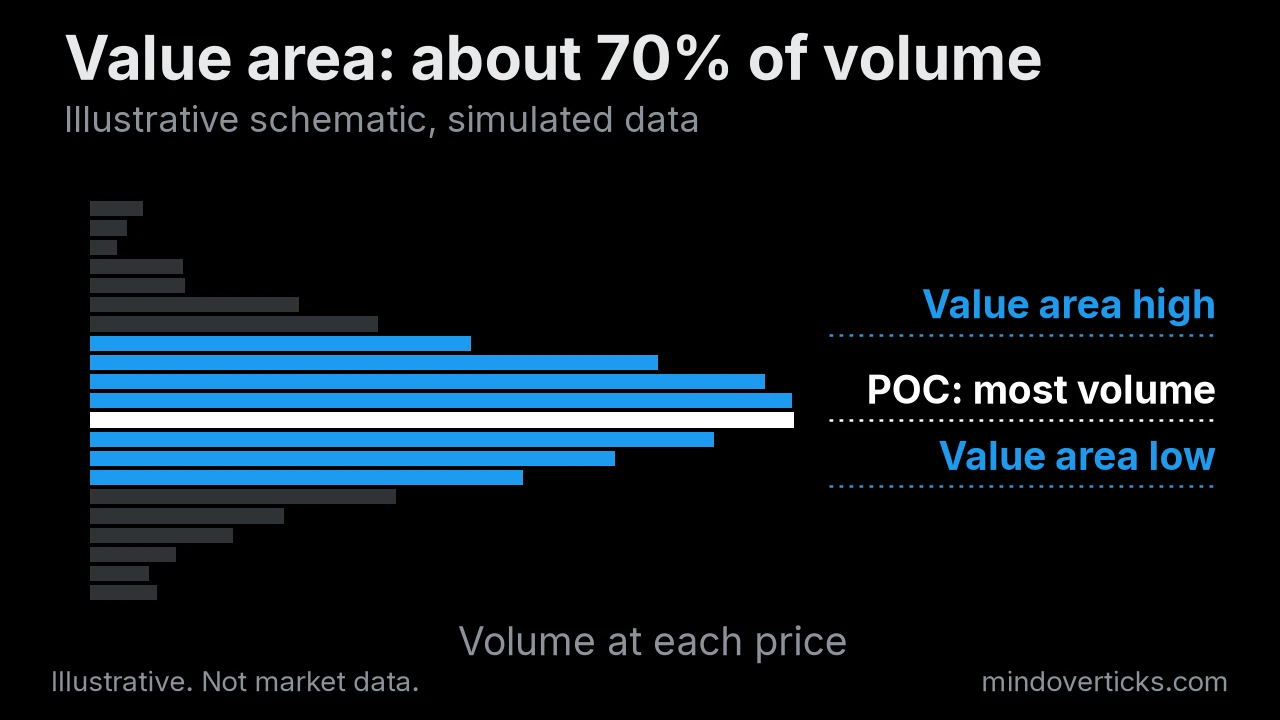
Three levels matter most:
- POC (point of control): the price with the most volume. The market’s best guess at “fair.”
- VAH (value area high): the top of the zone that holds roughly 70% of the volume.
- VAL (value area low): the bottom of that zone.
The 70% figure isn’t magic. It comes from the rough idea of one standard deviation in a normal distribution, and most platforms use it as a default. What matters is the concept: the value area is where the bulk of business got done.
Market Profile (the TPO chart) shows the same thing using time instead of volume. Each letter marks a 30-minute period that traded at a price. Same logic: lots of letters means lots of acceptance.
Balance and imbalance
Markets swing between two states.
Balance is when buyers and sellers roughly agree on value. Price rotates inside a range, bouncing between the edges. Think of a quiet, sideways day.
Imbalance is when one side takes over. Price leaves the old range and goes searching for a new area where trade can happen again. Think of a trend day.
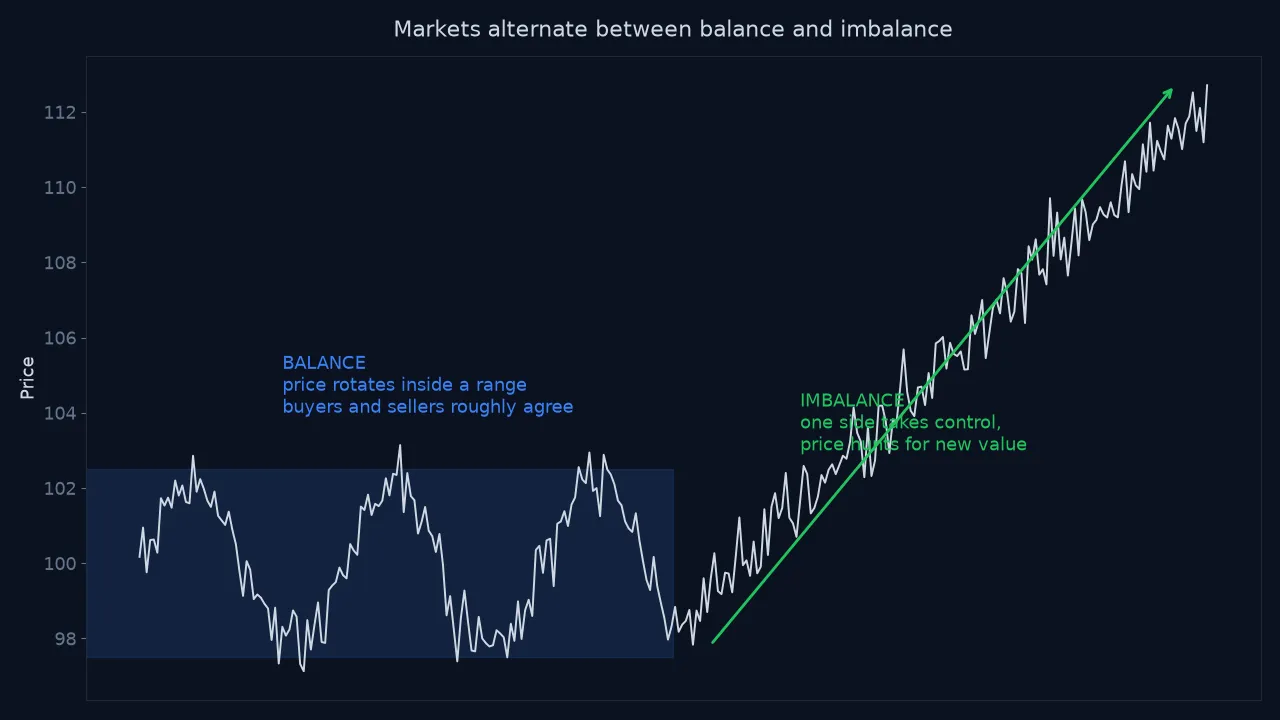
Here’s the part that matters for you as a discretionary trader: most of the time, markets are in balance. That’s why breakouts fail so often. Price pokes outside value, finds no new interest, and falls back in.
The four questions to ask at the open
You don’t need fancy software to use this. You just need yesterday’s value area and a few honest questions:
- Where are we opening relative to yesterday’s value? Inside, above, or below?
- If outside, is price being accepted out there? Is it holding and building volume, or snapping back?
- If inside, are we rotating? Then the edges of value are your playing field.
- Is anything forcing the issue? News, a big gap, a strong first hour. (More on that in price and time.)
A classic auction idea, often called the 80% rule in Market Profile circles, goes like this: if price opens outside yesterday’s value area, then gets back inside and holds for two 30-minute periods, there’s a decent chance it travels across to the other side. Treat it as a tendency to study, not a law. Test it on your own market before you trust it.
Acceptance vs. rejection
This is the auction version of “read the tape.”
Acceptance looks like time and volume building at a new price. The market likes it here.
Rejection looks like a quick spike into a price and a fast exit, often leaving a long wick or a thin spot on the profile. The market tried it and said no.
A thin spot in the profile, called a low-volume node, often acts like a slippery patch. Price tends to move through it quickly. A fat spot, a high-volume node, tends to act like a magnet or a speed bump.
Why this helps your head, too
Here’s an underrated perk. When you think in auctions, you stop taking price personally.
Price didn’t “stop you out on purpose.” It went looking for business below your level, found some, and came back. That’s just the auction doing its job. Traders who see it that way are a lot less likely to revenge trade after a stop-out.
It also kills a lot of FOMO. A fast move away from value isn’t a train leaving forever. Often it’s an advertisement nobody answers, and price drifts back.
Quick recap
- Markets exist to facilitate trade. Price moves to find it.
- Value area = where most trading happened. POC = the most-traded price.
- Markets spend most of their time in balance, which is why many breakouts fail.
- Watch for acceptance (time and volume build) vs. rejection (fast spike, fast exit).
- Next up: how this ties into Wyckoff’s ideas on accumulation and plain market structure.
Educational content, not financial advice. See our disclaimer.
FAQ
What is auction market theory?
Auction market theory is the idea that a market's job is to facilitate trade. Price moves up and down to find levels where buyers and sellers are both willing to do business, then explores away from those levels to test whether trade continues.
What is the value area?
The value area is the price range where most of a session's trading happened, usually defined as about 70% of the volume or time. Its top is the value area high (VAH) and its bottom is the value area low (VAL).
What is the point of control?
The point of control (POC) is the single price where the most volume, or the most time, was traded during a period. It's the price the market treated as most fair.
Up next · 4 minMarket Structure Trading: Highs, Lows and the Story of Every Trend