Mind
Price and Time in Trading: Why When Matters as Much as Where
The same breakout at 9:45 and at 12:30 are two different trades. Here's why the clock belongs on your chart.
Educational only, not financial advice (disclaimer).
Most traders stare at price. Where’s support? Where’s resistance? Where’s my stop?
Good question. Wrong half of the question.
A level means very little without the clock. When price gets somewhere tells you a lot about who is moving it and how serious they are.
The market has a daily rhythm
In U.S. stocks and index futures, activity isn’t spread evenly through the day. Research going back to the 1980s has found a rough U-shape: heavy volume and volatility near the open, a lull around lunch, then a pickup into the close.
That makes sense when you think about who’s trading. The open is when overnight news gets priced in and big players set their positions. Midday is when a lot of desks are, frankly, eating. The close is when funds rebalance and day traders flatten.
What this means for you:
- Breakouts near the open have more fuel behind them.
- Breakouts at midday fail more often, because there’s less volume to carry them.
- The close can bring sharp, real moves as positions get squared.
Your exact market may differ. Crypto runs 24/7 but still has busier hours. Forex follows the London and New York sessions. Pull up a volume-by-hour view of whatever you trade and learn its rhythm.
The initial balance
Market Profile traders put a lot of weight on the initial balance (IB): the high and low of the first hour of the regular session.
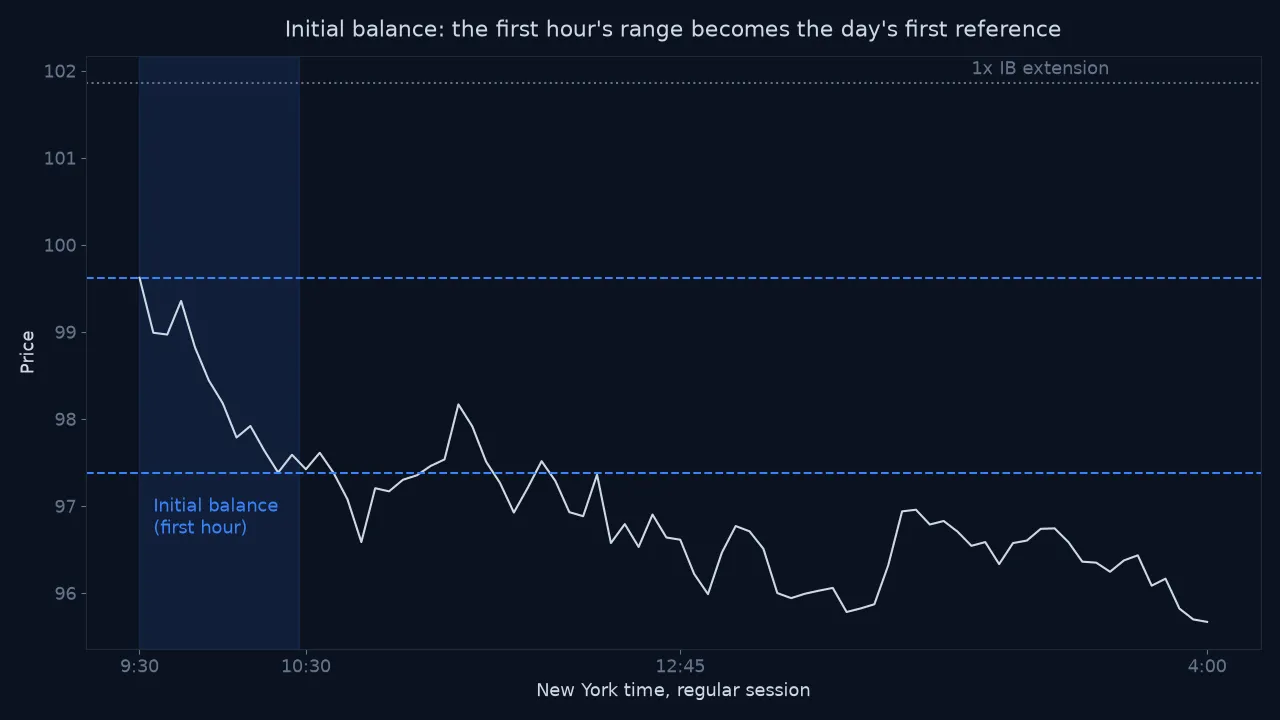
The idea is that the first hour is when early, short-term traders set a range. What happens next tells you whether bigger, longer-term participants agree.
- Narrow IB: the market hasn’t decided yet. Range expansion later in the day becomes more likely.
- Wide IB: a lot of the day’s work may already be done. Chasing extensions is riskier.
- Range extension: when price breaks the IB high or low and holds, someone with size is pushing in that direction.
Some traders project 1x or 2x the IB range as rough targets. Treat those as reference points, not prophecy.
Time at price = acceptance
Here’s where time meets auction theory.
If price spends a long time at a level, trading back and forth, the market is accepting it as fair. Volume and TPOs pile up there.
If price touches a level and leaves fast, that’s rejection. The market tried it and didn’t like it.
So when price breaks out of a range, the question isn’t “did it break?” It’s “did it stay?” A breakout that holds for 30 minutes and builds volume is a different animal from one that pokes out for a single candle. (This is also what separates real breakouts from the failed ones.)
Time-based stops
Most traders only use price stops. Try adding a time stop.
If you enter a momentum trade and it doesn’t move in your favor within a set window, something’s off. The urgency you were betting on isn’t there. Getting out flat beats sitting through a slow bleed and hoping.
This also helps your head. A clear “if nothing happens in 15 minutes, I’m out” rule takes the waiting and wishing out of the trade. That’s one less spot for revenge trading and second-guessing to sneak in.
Your own clock matters too
There’s one more kind of time that matters: yours.
Decision quality drops when you’re tired, hungry, or hours into a session. Research on fatigue and decision-making keeps pointing the same way. Plenty of experienced discretionary traders do their best work in the first 60 to 90 minutes and then mostly stop.
Look at your journal. Sort your trades by time of day. A lot of traders find that most of their profit comes from one window and most of their giveback comes from another. That’s free money sitting in your own data.
Quick recap
- A level means little without when price gets there.
- Volume tends to follow a U-shape: busy open, quiet midday, busy close.
- The initial balance (first hour) is an early reference for the whole day.
- Time at price = acceptance. Fast in-and-out = rejection.
- Add time stops, and find your own best trading window.
Educational content, not financial advice. See our disclaimer.
FAQ
What is the initial balance in trading?
The initial balance is the price range of the first hour of the regular trading session. Market Profile traders use its high and low as early reference points for the rest of the day.
What time of day is the stock market most active?
In U.S. stocks and index futures, volume and volatility tend to be highest near the open and near the close, with a quieter stretch around midday. This U-shaped pattern has been documented in academic research for decades.
What does time at price mean?
Time at price is how long the market spends trading at a given level. The more time spent there, the more the market has accepted that price as fair value.
Up next · 4 minThe Wyckoff Method Explained: Accumulation, Distribution and the Composite Man