Mind
The Wyckoff Method Explained: Accumulation, Distribution and the Composite Man

A stock-market reporter from the 1900s figured out how big money hides its footprints. His map still works.
Contains affiliate links; we may earn a commission at no cost to you (details). Educational only, not financial advice (disclaimer).
Richard Wyckoff was a Wall Street reporter and trader in the early 1900s. He watched the big operators of his day move stocks around, and he noticed something.
They couldn’t buy everything at once. They had to sneak in. And sneaking in leaves footprints.
His method is a way to read those footprints. More than a century later, it’s still one of the most popular frameworks among discretionary traders.
The composite man
Wyckoff asked his students to imagine one giant player behind every move: the composite man. It’s a thought tool, not a conspiracy theory.
The composite man wants to buy low and sell high, like everyone. The difference is he’s big. To build a large position, he needs a lot of sellers. To unload it, he needs a lot of buyers. So he tends to buy when the crowd is scared and sell when the crowd is excited.
Thinking this way pushes you to ask a better question than “is this going up?” The better question is: “Who’s on the other side of this, and why would they be?”
Wyckoff’s three laws
1. Supply and demand. When demand beats supply, price rises. When supply beats demand, it falls. Obvious, but everything else is built on it.
2. Cause and effect. A big move (the effect) needs a big buildup (the cause). Long sideways ranges are the cause. The longer and wider the range, the bigger the potential move after it.
3. Effort vs. result. Volume is effort. Price movement is result. When they match, the move is healthy. When huge volume produces little movement, something’s absorbing it, and that’s worth noticing.
Accumulation, step by step
Here’s a simplified version of Wyckoff’s accumulation schematic. Real charts are messier, but the beats are often recognizable.
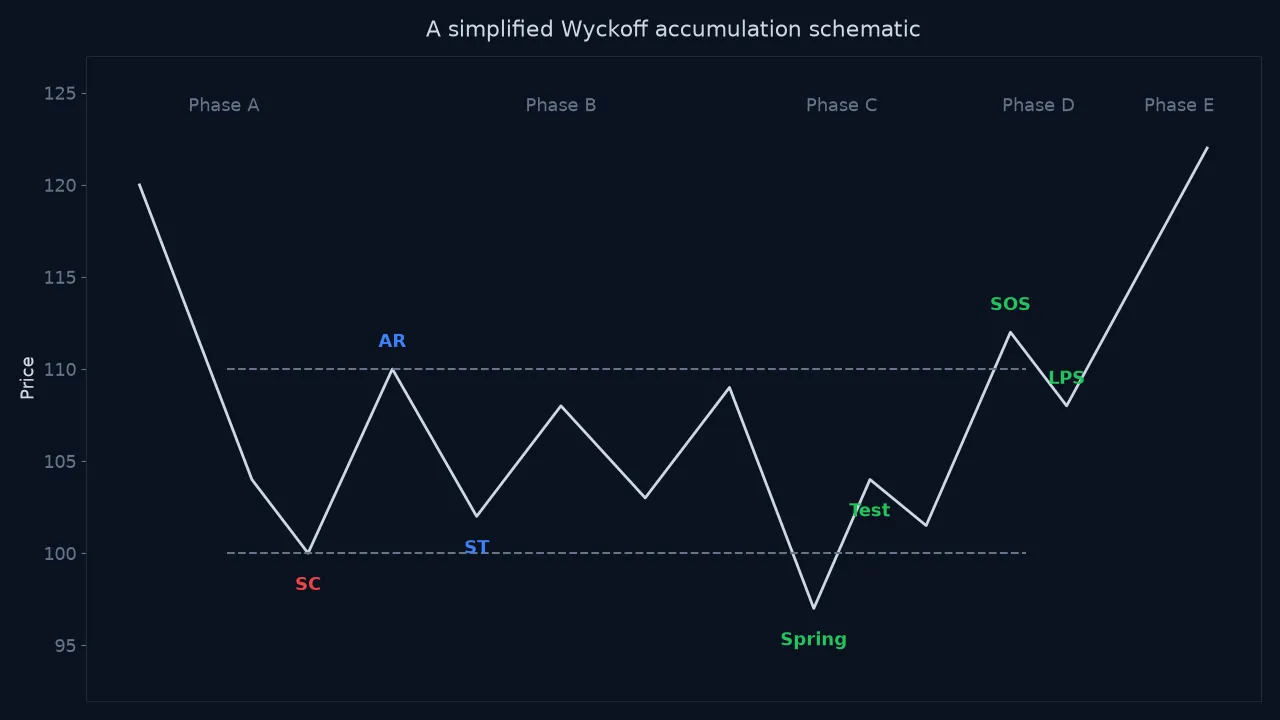
Phase A: the selling stops. After a downtrend, a sharp selling climax (SC) hits on heavy volume. Panic. Then an automatic rally (AR) bounces as shorts cover. A secondary test (ST) revisits the lows on lighter volume. Those levels frame the range.
Phase B: building the cause. Price chops sideways. This is where the composite man quietly buys from people who are sick of waiting. It’s boring. That’s the point.
Phase C: the shakeout. A spring dips below the range low, triggers stops, and snaps back. Weak hands are out. If a quick test of that low holds on light volume, supply looks used up.
Phase D: demand shows up. A sign of strength (SOS) pushes through the top of the range on expanding volume. A last point of support (LPS) pulls back and holds above it.
Phase E: markup. The trend leaves the range. The crowd notices late.
Distribution is the mirror image: a buying climax, a sideways range, an upthrust above the highs that fails, then a markdown.
How it connects to everything else
If this feels familiar, it should.
- A spring is a failed breakdown: rejection below a range.
- A sideways range is balance in auction terms. Markup is imbalance.
- The SOS and LPS create a new higher high and higher low.
Different traditions, same market, same people underneath.
The honest warning
Wyckoff is a lens, not a crystal ball. It’s very easy to label a chart perfectly after the move. In real time, a “spring” can just be the start of a breakdown.
That’s why the method leans on tests and confirmation. Wait for the spring to hold. Wait for the sign of strength. Define where you’re wrong (usually back below the spring low) before you enter.
And watch your own bias. Once you fall in love with a Wyckoff count, you’ll start seeing what you want. Your journal is the place to keep yourself honest.
Quick recap
- Wyckoff reads price and volume to spot big players building or unloading positions.
- The composite man is a thinking tool: who’s on the other side, and why?
- Three laws: supply and demand, cause and effect, effort vs. result.
- Accumulation: SC, AR, ST, spring, test, SOS, LPS, markup.
- It’s a lens. Wait for confirmation and know where you’re wrong.
Educational content, not financial advice. See our disclaimer.
FAQ
What is the Wyckoff method?
The Wyckoff method is an approach to reading markets developed by Richard D. Wyckoff in the early 1900s. It studies price and volume to spot when large, informed players are accumulating or distributing positions.
What is a Wyckoff spring?
A spring is a quick move below the support of a trading range that fails and snaps back inside. In Wyckoff's framework it often marks a final shakeout before an uptrend begins.
Does the Wyckoff method still work?
Its core ideas about supply, demand and effort versus result are widely used by discretionary traders today. Like any discretionary method, it depends on the trader's skill in applying it, and ranges don't always resolve the way a schematic suggests.
Up next · 7 minHow to Stop Revenge Trading: A Discretionary Trader's Protocol